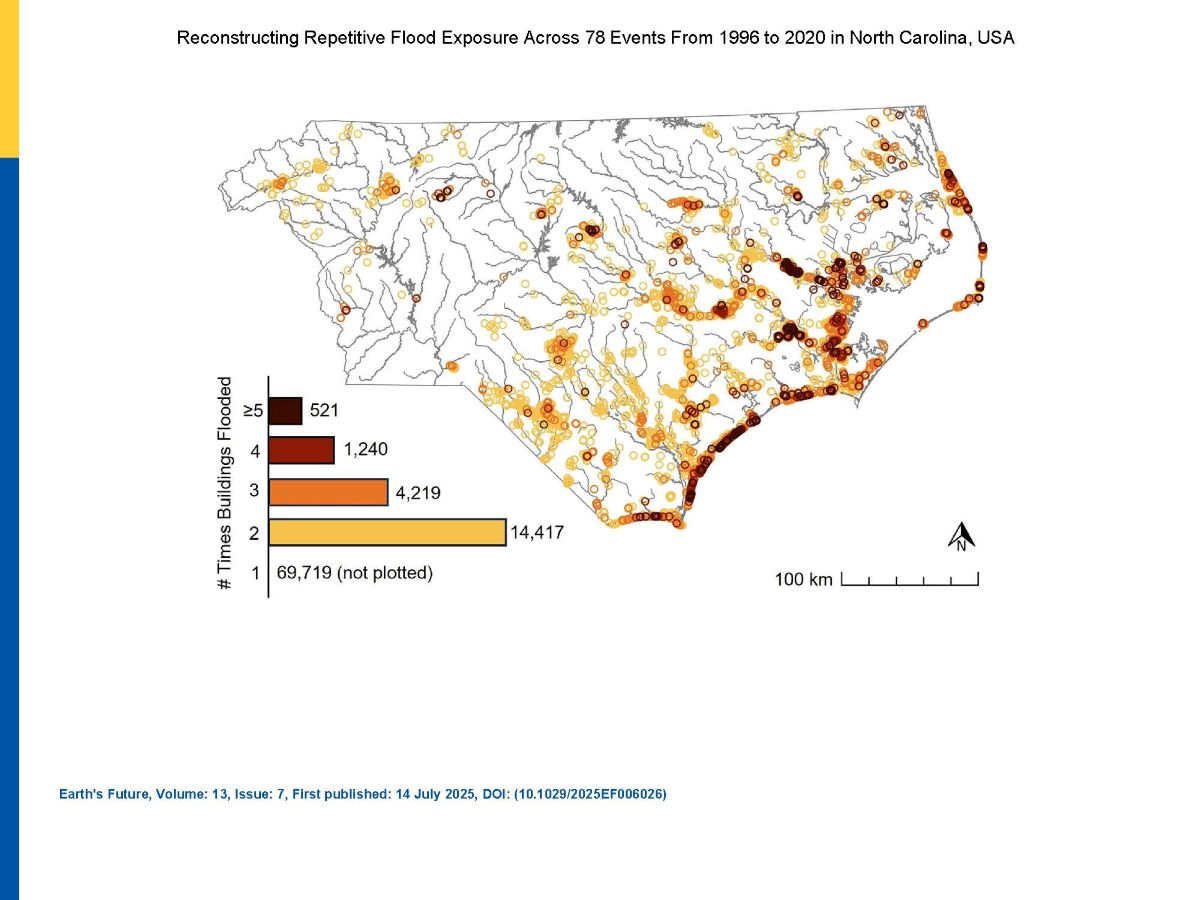
More buildings in 78 North Carolina counties between 1996 and 2020 were exposed to flooding than previously recognized, and almost half of them were not within the federally designated areas that require flood insurance, a new study finds.
University of North Carolina Chapel Hill researchers used anonymous, address-level National Flood Insurance Program records and observational damage to create maps of 78 flood events that three-quarters of the state experienced during those 25 years to determine which buildings experienced flooding and how often.
Supporter Spotlight

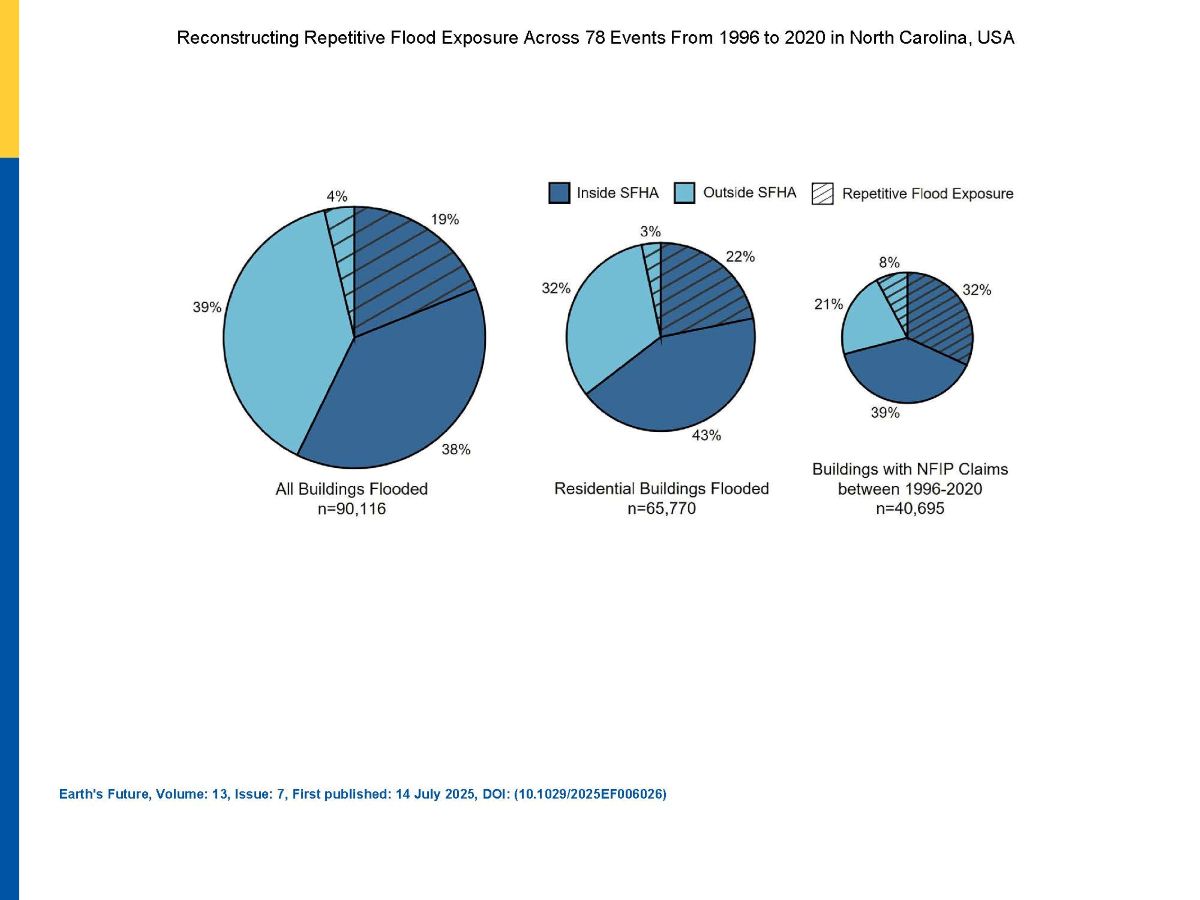
They found that more than 90,000 buildings flooded at least once, which they predict is “more than twice the number of flooded buildings compared to those at addresses associated with NFIP claims filed between 1996 and 2020,” according to the study published Monday in Earth’s Future, an Advancing Earth and Space Sciences journal.
The study’s results “illustrate that flood exposure, especially repetitive exposure, is much more widespread than previously recognized” and “demonstrate the value of simulating flood events beyond those that generate the most damage and get the most attention from governments, media, and researchers. This first-of-its-kind database of flood maps can be used to better understand how flood exposure, vulnerability, and risk change over time.”

Lead author Helena Garcia, a doctoral candidate in UNC’s Environment, Ecology, and Energy Program, told Coastal Review that the team mapped the nearly 80 events to look at how much flooding at the building level has occurred across those events in those 25 years.
“We know a lot about some of the larger events, like hurricanes Florence and Matthew, but we had questions about some of the other events, too,” she said.
The team used the flood maps they created to build an index to determine what buildings had flooded and how often.
Supporter Spotlight

“When we did that, we found that over 90,000 buildings flooded in at least one of those 78 events, with about a quarter of those buildings, or 20,000 of them, flooding in two or more events,” Garcia said. Adding, that of those events, there were 44 that had tropical cyclone activity, and many of the buildings were damaged during those storms.
These findings provide an estimate of how much repeat exposure is happening, especially outside of the large events, like the fall 2018 Hurricane Florence, Garcia said.
The study shows that 43% of the structures that flooded out of that 90,000 were located outside of the Federal Emergency Management Agency-mapped flood zones, Garcia said. “The people that had flooded during some of those events might not have known or realized that they had flood risk at their property.”
FEMA’s Special Flood Hazard Area, or SFHA, is where the National Flood Insurance Program’s “floodplain management regulations must be enforced and the area where the mandatory purchase of flood insurance applies,” according to FEMA.
Antonia Sebastian, assistant professor in UNC’s Environment, Ecology, and Energy Program and Department of Earth, Marine, and Environmental Sciences, told Coastal Review last week that a key takeaway from the study was how much flooding happened outside of mapped floodplains.
FEMA “floodplains are used as the primary indicator of high-risk areas, but flooding can occur outside of them,” Sebastian said. “We weren’t surprised that we had a lot of flooding outside of floodplains, but I think it’s a really important for people to recognize that even if you live outside of a floodplain, you could flood, and we’re finding some of these repetitive flooding hotspots in areas that aren’t mapped.”
About the study
The study area spans eight watersheds, including the entirety of the Neuse-Pamlico and Cape Fear River watersheds as well as portions of the Chowan-Roanoke and Pee Dee River watersheds.
For the study, the researchers used anonymous records of address-level NFIP policies in force and claims from the mid-1970s to 2020 from FEMA for the 78 counties overlapping these watersheds, which is about 77% of the state’s land area.
They used the available NFIP insurance data to map the flood events because it’s not a time-intensive method like physics-based models, and they could produce the flood maps quicker, Garcia explained.
She added that they would have looked at the entire state but the insurance data the team had access to was only available on the three-quarters of the state.
To determine what flood events to analyze, Garcia said the team established a threshold based on data from the 18 flood-related presidential disaster declarations for the study area from the 25-year period.
“We made sure that our algorithm found all of those (18 events) and also found 60 other events,” she said.
The findings highlight flooding hot spots and that information can be helpful for preparedness, mitigation and resilience efforts for these locations.
“We want to make sure that those are the places we’re putting the funding toward, because they need it the most, Garcia said. “And then in the future, I think it’s something to keep track of, to figure out are these hot spots of repetitive flooding shifting as we see different types of flood events that could be more intense or more widespread.”
One of the challenges the team encountered while working on the study was determining what counts as a flood event, Garcia said.
“There’s definitely flooding that happened over this 25-year time period that doesn’t show up in these 78 events, just because it didn’t fit the algorithm,” she said.
To define the flood events, researchers looked for flooding with at least 15 claims recorded within a seven-day period in the same watershed boundary. They chose that threshold because it included all 18 flood-related FEMA federal disaster declarations that occurred within the study area between 1996 and 2020.
Garcia said the biggest surprise for her was how many buildings experienced flooding and repetitive flooding, and not just on the coast. There are properties in inland areas like Lumberton, Winston-Salem and Chapel Hill.
Sebastian said that while the study answered questions, “the coolest thing about this study is all of the potential types of things we can do now with this information.”
Garcia said that with this data set, “we can look at impacts of floods and outcomes over time a wider range of events than we’ve currently or really been able to do so before,” such as financial and health impacts.
“Here we can focus on multiple events and also what happens when people see repeat exposure over time. So, what I’m doing with that is looking at basically people and their movements through time,” Garcia said, adding that there was also interest in finding out whether people are continuing to stay in these repetitive flooding hotspots or moving to lower their flood risk. “Does your experience with previous flooding kind of inform your next residential move, if you do choose to move?”