MOREHEAD CITY — Until recently, restoration managers trying to find the best place to restore an oyster reef in North Carolina sounded like guest stars on a science version of HGTV.
“What’s the water like? How far is it from other reefs? Do you love it or list it?”
Sponsor Spotlight

“We’ve tried to develop a more comprehensive model that integrates 17 factors to provide a more objective, holistic approach to siting oyster restoration,” said Brandon Puckett, research coordinator for the North Carolina Coastal Reserve and National Estuarine Research Reserve, or NCNERR.
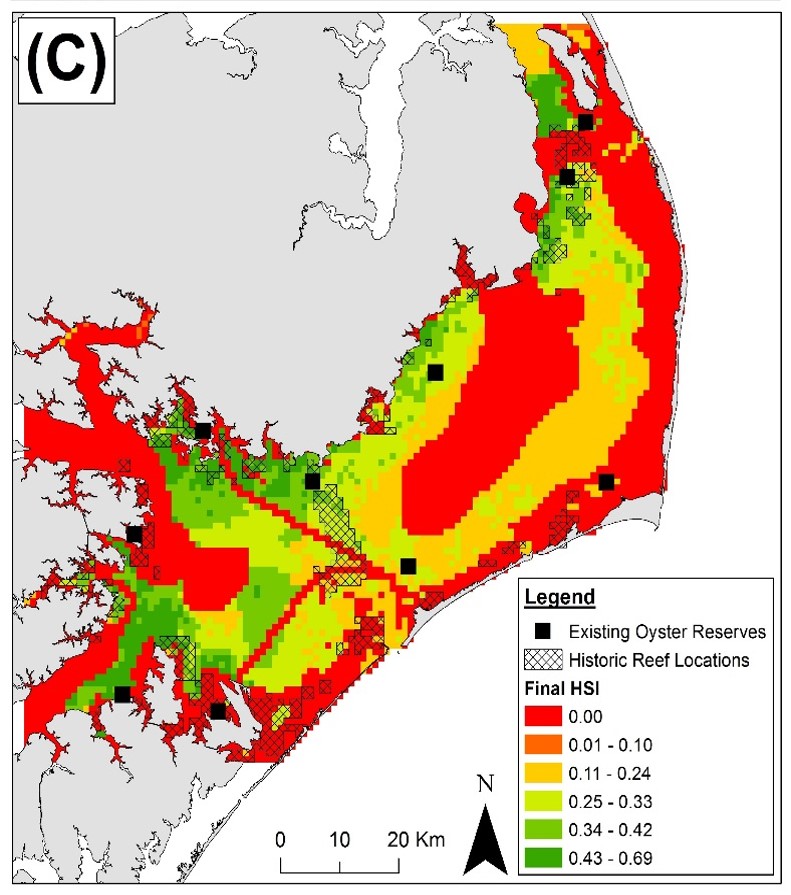
The model generates an interactive map that visualizes optimal oyster habitat based on biotic, abiotic and logistical parameters.

“The idea was basically to bring together all these needs and these datasets within a single tool to help identify where is best to restore reefs,” said Seth Theuerkauf, who helped develop the model as a doctoral student at North Carolina State University. “It was really stakeholder-driven from the outset.”
Sponsor Spotlight
According to Puckett, restoration used to be guided in part by maps of historic oyster reefs in Pamlico Sound drafted in the late 1800s by Lt. Francis E. Winslow of Connecticut, who spent years surveying and studying oysters. However, due to changing conditions, legacy locations may no longer be the best place for new reefs. The oyster habitat model helps restoration managers identify what might be feasible today.
A Tool for Pamlico Sound
The mapping tool was recently shared through a paper in Frontiers in Marine Science written by researchers at N.C. State, the University of North Carolina, NCNERR, and North Carolina Department of Marine Fisheries, or NCDMF. It’s already being used to select locations for oyster restoration.

“The model has been helpful in prioritizing areas of Pamlico Sound where further, detailed investigations should be done to plan for oyster restoration,” said Erin Fleckenstein, coastal scientist at the North Carolina Coastal Federation. “With the Pamlico Sound being over 2 million acres in size, having a smaller targeted area to do site investigations helps to narrow and prioritize efforts.”
For example, the model helped identify the mouth of the Neuse River in Pamlico Sound as a promising site, and work in that area has continued for the past couple years to create the Swan Island Oyster Sanctuary. Agencies can easily use the model for their needs since it was developed with their input. Representatives of state and federal agencies, non-governmental organizations and universities were active participants in the model’s development.
A version of the model can also be accessed online. “We worked with The Nature Conservancy of North Carolina to implement it within Restoration Explorer,” Theuerkauf said, “and so that basically allowed the tool to go from being on my desktop into a web-based platform.”
The tool’s utility isn’t limited to Pamlico Sound. “The concepts can apply in any ecosystem in which one might restore a habitat or population of organisms,” said David Eggleston, N.C. State distinguished professor and director of N.C. State’s Center for Marine Science and Technology, or CMAST, in Morehead City. He cited its use in mapping shellfish aquaculture in North Carolina and coral reefs in Florida.
Jump-Starting Recovery
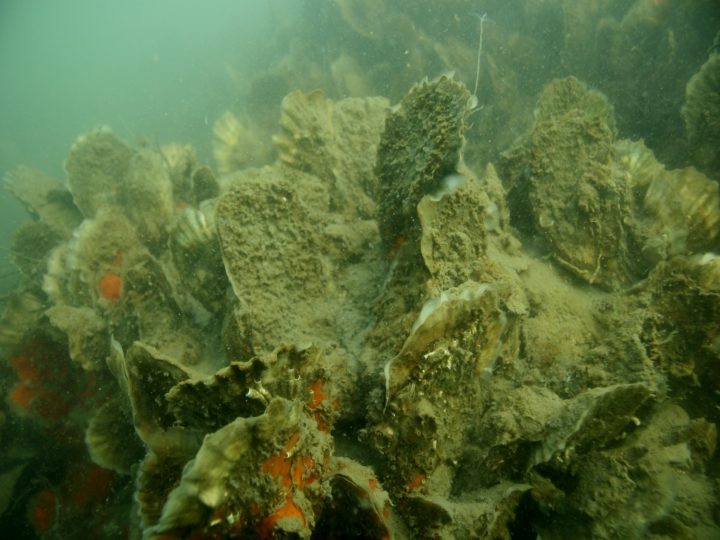
The state’s interest in oysters may be no surprise to anyone following coastal issues. Oysters help improve water quality, reduce coastal erosion and shelter juvenile fish. They are also harvested for commercial purposes.

Oysters are valuable, but they’re also in trouble. Bolstering the state’s oyster population has become a recent priority after diseases, overharvesting and invasive pests have reduced oyster populations to 10 to 15 percent of historic numbers. The mapping tool was developed to support efforts to reverse that trend.
“In 2007, I had a conversation with Mr. Craig Hardy, who was at the time director of the NCDMF Shellfish Restoration Division, regarding the NCDMF Oyster Sanctuary Program,” Eggleston recalled.
The Oyster Sanctuary Program restores oyster reefs so they can produce the larvae necessary to jump-start the recovery process. Harvesting is not permitted at sanctuaries.
Eggleston explained that Hardy needed to know whether the division’s work was fostering a network of oyster reefs “that would provide a type of larval insurance policy to the entire Pamlico Sound oyster metapopulation.”
Eggleston and Puckett, then a doctoral student in his lab, started developing the model that would ultimately answer Hardy’s question. They began by focusing on larvae.
Puckett explained that larvae are carried through the water by wind and currents for two to three weeks before they settle on a hard surface – such as empty oyster shells piled by DMF in just the right spot. Like sailboats on a lake, oyster larvae stay within a relatively contained area as they drift from their natal reefs to settlement locations. Scientists call this movement “larval dispersal.”
“Understanding oyster larval dispersal is fundamental to understanding, modeling and predicting how their populations will change over time, and, therefore is important to consider when deciding where to restore oyster reefs,” Puckett said.
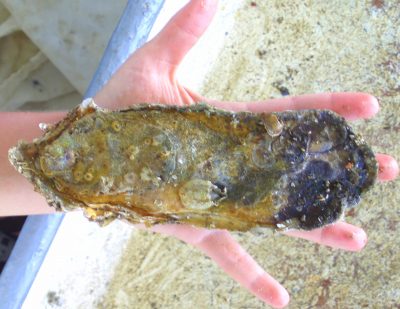
The oyster mapping tool includes multiple representations of larval dispersal. There are data that show where larvae are most likely to settle, which can be used to situate reefs that can be populated quickly. Other data illustrate spawning hotspots that are most likely to provide new larvae to existing reefs.
“Siting restored reefs in locations that maximize both larval import and export is critical for promoting a network of oyster reefs that each help to sustain one another,” Puckett said.
The physics of larval movement in the model are powered by ADCIRC, a program co-developed by Rick Leuttich, professor at UNC and director of the UNC Institute of Marine Sciences in Morehead City.
Larval dispersal is an important consideration in the model, but it’s not the only one. To understand how the model fits together, it’s useful to take a quick peek behind the scenes.
Stacking Layers for Survival
The mapping tool was created with geographical information systems, or GIS. When it’s first opened, GIS displays satellite imagery that looks a lot like Google Earth. GIS has become an invaluable tool for scientists because it allows them to add spatial information to that imagery.
For such an advanced tool, GIS can be explained with a comparison to something long removed from most classrooms: overhead projectors. If you have no memory of this in your classroom, check the card catalog … err, Google it.
Here’s a simple example. Start by imagining a map of the U.S. printed on a transparency and projected onto a screen. Place a blank transparency on top of that map and use markers to color regions of the country with an average temperature warmer than 50 degrees.
Each transparency slide is akin to a GIS layer: It contains cartographic features that can be superimposed on a satellite image. The difference is that GIS layers also contain information about the parameter. If our overhead projector example was a GIS project, the user could click on one of the states to view its average summer temperature.
Layers can also be stacked on top of each other. Imagine adding a transparency to the previous example and coloring only coastal states. Based on the overlap, it’s easy to identify coastal states with warmer temperatures. The same can be done in GIS.
To create the oyster model, scientists started with a map of Pamlico Sound. They added layers containing data about parameters that are relevant for oyster survival, such dissolved oxygen concentrations, salinity, or larval dispersal. When these layers are mapped together, they generate a map of optimal oyster reef locations based on biological and physical factors.
“A lot of these tools are developed from the academic perspective, focused really exclusively often on just oyster biology, like what restoration location would be best from an oyster’s perspective, which is really important,” Theuerkauf said. “But a lot of factors that we also incorporated were focused on logistical constraints.”
“The Coastal Federation helps to organize a regional oyster workgroup,” Fleckenstein said. “One task that we’ve helped with in recent years is reviewing and providing feedback on the oyster sanctuary model that Brandon and colleagues have developed.”
Members of the work group provided feedback on the parameters that should be included in the model and their relative importance in restoration success. They recommended the addition of layers that mapped Pamlico Sound using binary values for parameters such as presence of submerged aquatic vegetation and public boat ramps within 10 kilometers or 6.2 miles. These layers illustrated logistical considerations, showing where in Pamlico Sound it was realistically feasible to consider restoring a reef.
Theuerkauf explained that the model would not have been possible without field data, much of which was collected for another purpose. For example, the model incorporates dissolved oxygen readings the DMF has taken during fish surveys.
“I think it’s just really neat to see how those types of datasets have a lot of value,” Theuerkauf said. “They should be collected in the future.”
Powered by all that data, the model demonstrates that Pamlico Sound has some very valuable real estate – at least, if you happen to be an oyster.
Funding for the project was provided by the North Carolina Coastal Recreational Fishing License Program, North Carolina Sea Grant and the National Science Foundation. Additional funding was provided by a North Carolina Sea Grant and North Carolina Space Grant Fellowship, a National Defense Science and Engineering Graduate Fellowship, a North Carolina Coastal Conservation Association Scholarship and a Beneath the Sea Foundation Scholarship.


