Despite what some experts view as significant problems in some coastal areas, the program director of the North Carolina Floodplain Mapping office believes the proposed new flood insurance rate maps are good, but will get better before final adoption next year.
John Dorman said he knows of the issues raised in recent weeks by coastal engineer Spencer Rogers, co-vice chair of the state Coastal Resources Advisory Council, and Rudi Rudolph, advisory council chairman and Carteret County shore protection office manager. Dorman appreciates them pointing out areas that in recent storms have flooded far worse than the maps appear to indicate they should.
Supporter Spotlight

“We have talked to Spencer and Rudi … but we feel like the maps are generally very accurate,” Dorman said. “We did about three years of studies on storm surge … and we’ve checked and re-checked and re-checked our models.
“We know there are some areas that flooded along the coast (in Hurricane Matthew in early October) more than the maps might indicate. But again, generally, we think the maps are good. And we are talking to and listening to those who raise these issues.”
Rogers and Rudolph spoke during Carteret County Beach Commission’s meeting last month, and have recommended that the state put together an ad hoc group to review and try to solve what they view as potential conflicts between state rules and the most recent flood maps, which were produced by the state and the Federal Emergency Management Agency. They pitched the idea earlier this fall to the council, which advises the state Coastal Resources Commission, and will pitch it again to the full commission during its meeting Nov. 30-Dec. 2 at the Hilton Doubletree in Atlantic Beach.

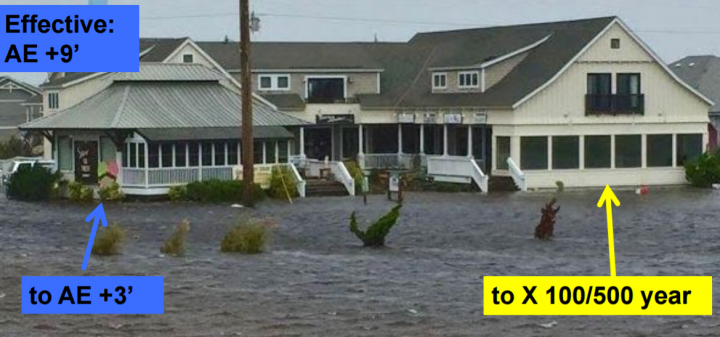
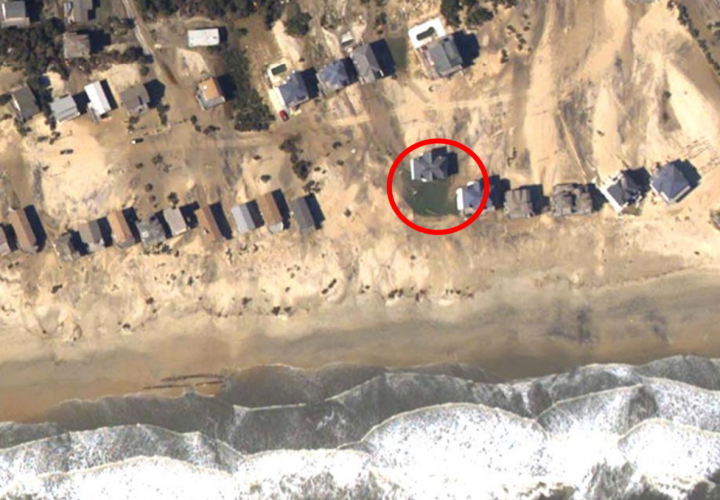
Their PowerPoint presentation shows clear contrasts between where some flood elevations would be set in the new maps, and where some flood levels have been in storms in recent years. Specifically, it shows numerous instances in which buildings that have flooded in recent storms – some severely damaged or destroyed – have been rezoned in the proposed new maps from the highest hazard areas, along the oceanfront or soundfront, to a non-flood zone, or at least into lower-risk zones. In other instances, Rogers told the beach commission, flood risks appear to have been overstated.
That, he said, sets up some potential conflicts with setback requirements under the state’s Coastal Area Management Act, and possibly some conflicts with state building codes, which govern what kinds of things can be built in flood zones and whether buildings must be elevated or not in those locations. For example, some properties that would be moved from the VE (wave zone) could, under the new zone they are in, be allowed to have buildings that are not elevated, or could have basements.
Supporter Spotlight
But the state has to use the maps once they’re adopted, and the local communities and insurance providers do, too.
To examine those kinds of issues, Rudolph and Rogers would like to see the state get members of the commission and its advisory council, the state Building Code Council and representatives of the North Carolina Floodplain Mapping Program, together to talk.
The rate maps show the flood risks in various areas of communities in the United States and designate high-risk areas (areas with a 1 percent or higher annual risk of a flood, known as a 100-year flood) and moderate to low-risk areas (areas with a less-than 1 percent annual risk of a flood).
On rate maps, areas of moderate to low risk are zoned B, C or X. Higher-risk areas are in zones that begin with either the letter A or V. Areas of undetermined risk are zoned D.
In high-risk areas, flood insurance is mandatory for federally backed loans. In moderate to low-risk areas, flood insurance is recommended, but optional.
Rogers and Rudolph point to structures in locations such as Hatteras and Wrightsville Beach that Rogers said don’t meet the “smell test” for accuracy. They also show examples in Carteret County, including one in Emerald Isle, but said most of the major problems appear to be in Wrightsville Beach and in Hatteras.
In years past, FEMA did all the work on the maps for the state, but that has changed in recent years. After Hurricane Floyd exposed major problems with the maps in 1987, he said, efforts to improve the maps began, but proceeded very slowly, only one county per year.
More than half of the maps at the time were older than 10 years, and three-quarters were at least five years old. But most counties didn’t have the money or staff to do their maps on their own.
Then in 2000, as a result of prodding by then-Gov. Jim Hunt, 22 federal and local community entities joined North Carolina and FEMA in an agreement to work together to update and maintain accurate, up-to-date flood hazard data for the state, and North Carolina created the Flood Plain Mapping Program.
Eventually, the state took over the program lead, with FEMA’s OK, and most feel it’s done a much better job, in part because it depends more on locals who know the areas better, but also because the technology used is much better.
Scientific models created over the past few years, incorporating storm surge and other data from more than 20 named storms since the early 1980, helped hone the maps.
While models are fine, Rogers said, it’s also important that real-world judgment augment those models. “But what we are getting is “modeled maps, for better or worse.”
Dorman, on the other hand, remains confident that the maps his office has and is producing are better than the feds did on their own, but is open to help.
“If anyone has better models or data, we’re certainly interested in seeing it,” he said. “We’re willing to sit down and listen to anyone.”
The state will take comments next year on the draft maps, which, so far, are expected to go into effect sometime in 2018. There is an appeal process, but appeals, if they happen, aren’t likely to come from people who have been moved out of flood zones or moved to lower hazard zones. Rather, they’ll come from areas – often on the sound sides of coastal counties – where the new maps place some homes and businesses in higher-hazard zones.
While no one has formally appealed yet, there have been major concerns expressed by residents and government officials in towns, including Jacksonville and Morehead City.
In Jacksonville, more than 800 additional structures in the downtown region would be placed in various flood zones, and many that were already in flood zones would have be elevated, some as much as 10 feet, largely because of the storm surge modeling.
In Morehead City, nearly 900 buildings would be added to the A zone, while there would be a slight decrease in buildings in the V zone.
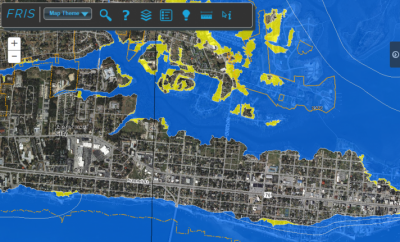
In both towns, the changes would affect where new homes and businesses could be built, and how, and some people who had no flood insurance before would face thousands in annual premium costs.
Dorman said his office is making special efforts to meet with officials in such places and try to resolve differences and come up with the best maps possible; they’ve already had meetings to get input from residents and officials.
“Our goal is to use the best data available to produce the best, most accurate models possible,” he said. “If we get better data, we can make adjustments. We want everyone to be as satisfied as possible with the maps that are eventually approved.”
Dorman said he realizes that farther inland, in Kinston and other towns, Matthew caused torrential rains that triggered devastating flooding of areas that the maps indicate shouldn’t flood in 100-year storms.
But, he added, there’s really no way to map for a rainstorm that is generally considered once in a lifetime, if 12 to 18 inches of rain, and in some cases more, fell in less than two days.
“We’re pretty confident in that inland mapping, too,” he said. “We have studied 30,000 stream miles. But there were areas in seven or eight counties that experienced close to a 1,000-year rainfall event over a 24-hour period.” Again, though, he said his office is willing to listen.
But, Dorman said, most folks appear to be relatively happy with the proposed maps. Coastwide, more than 10,000 structures were either moved out of flood zones or placed in zones considered less hazardous, changes that would result in lower insurance premiums. For example, in Emerald Isle, in Carteret County, the number of buildings in the VE zone – the highest danger zone for flooding – will decrease from 1,135 to 441 if the new maps are approved as is. Some were moved out of the flood hazard zones entirely.
In the latter case – buildings moved out of flood zones – Dorman said the state is not saying there is no flood risk at all, and many factors affect where flooding will occur. Strength of a storm comes into play, but so does the storm’s angle of approach and the duration of the event.
“So many structures are still at some risk,” no matter what the maps indicate, Dorman said. “We saw that with Matthew in some cases in some areas. But in those instances, it was greater than a 500-year event (a 500-year storm event occurs, on average, once in 500 years, or has a 0.2 percent probability of occurring or being exceeded in any given year).
Dorman said the office still encourages those who might be near hazardous flood zones to buy insurance, as premiums for them would be much lower than those who are in hazard zones.
Rogers noted that all of those “events” – 100-year storms, 200-year storms, 400-year storms – merely reflect probabilities and averages and can, and do, occur more frequently, particularly if you consider effects in specific local areas.
In addition, he said, the category of a hurricane – 1 is weakest, 5 is strongest – doesn’t always correlate to storm surge. Some weaker storms generate higher surge than stronger storms.
Still, he agreed the state’s mapping efforts are much more accurate than the previous ones undertaken by FEMA, and said he doesn’t expect the ad hoc group conversation he and Rudolph are encouraging to add regulations.
Back in the 1980s, “we made some significant improvements in the building code” as a result of such efforts, he said. If the new maps are not adjusted to take care of the problems he and Rudolph noted, the idea is to find ways to better apply existing regulations to the new maps.
Rudolph said he understands that it would be very difficult for the state to make big changes; the mapmakers would have to run more models with different storms, and it would be very time consuming and expensive, to change the results of years of work. And, like Rogers, he praised the improvements the state has made, compared to the old FEMA maps.
On the other the hand, Rudolph noted that planners in some of the coastal counties, including Dare, have indicated they are concerned about the large number of structures moved out of the hazard zones.
The bottom line, though, Rudolph said, is that he and Rogers hope that with the Coastal Resources Commission’s blessings, talks among the various offices involved can “make the best of the situation.”


