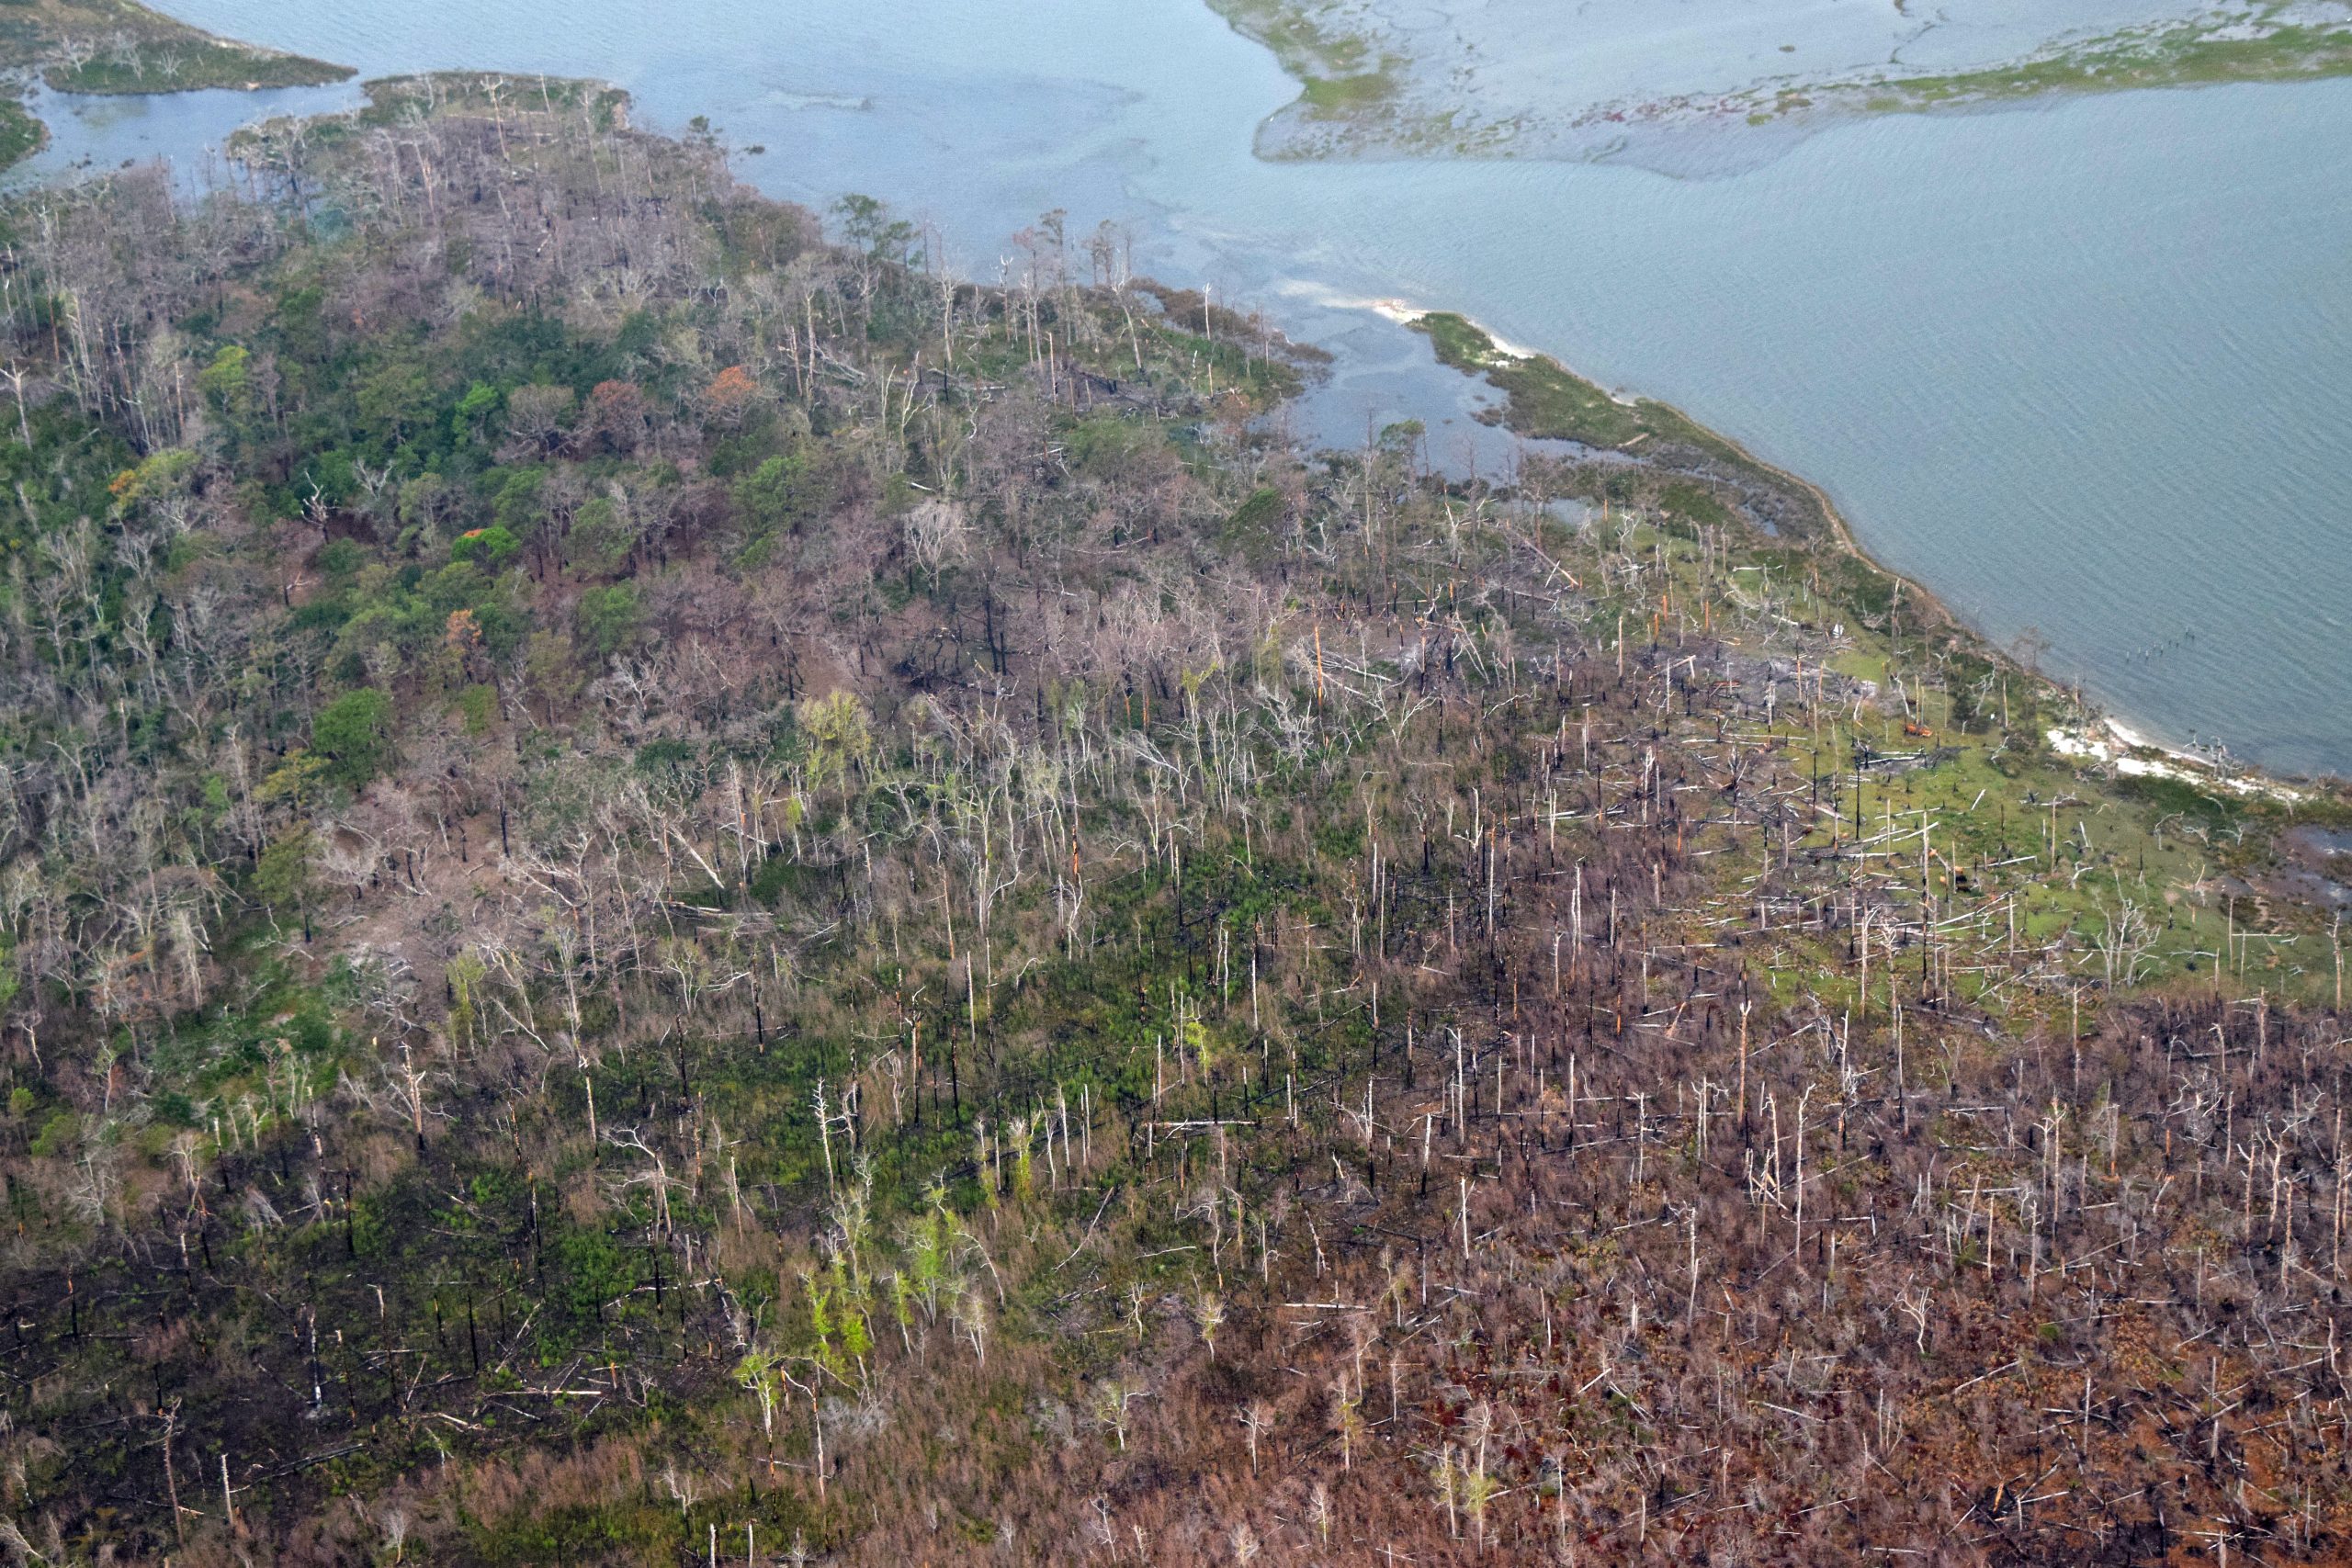
Evidence of the rising sea is visible along North Carolina’s coast.
Storms that are more intense and destructive, floods that reach further and run deeper, and marks of habitat shift such as ghost forests are indicators that every year the ocean sits just a little bit higher.
Supporter Spotlight
Sea level rise is a problem that affects coastal communities around the world, and thanks to a new study from researchers in the Netherlands, global sea level rise vulnerabilities are being mapped with unprecedented detail. Never before has elevation been mapped globally with such a high degree of accuracy.
According to the recent study, “Global LiDAR Land Elevation Data Reveal Greatest Sea-Level Rise Vulnerability in the Tropics,” published in Nature Communications, the brunt of this change will occur within the tropics.
This study is the first worldwide elevation model that used satellite Light Detection and Ranging, or LiDAR, data. By taking a global approach, the researchers were able to evaluate what parts of the world are most vulnerable to sea level rise. They classified high vulnerability as coastal lowlands less than 2 meters, or about 6 feet, above sea level. They found that 62% of those areas are in the tropics, making this region particularly vulnerable to sea level rise. Around the world, 267 million people live in these vulnerable areas.
According to Dr. Aljosja Hooijer, primary author on the study, these results are conservative. Hooijer used a relative sea level rise projection of one meter by 2100. Even with such a moderate value, Hooijer found that by 2100, 410 million people could be living in those vulnerable areas.
While North Carolina is not in the tropics, much of the eastern part of the state is extremely vulnerable to sea level rise. Approximately 47% of the Albemarle-Pamlico Peninsula sits below 1 meter in elevation, and this region has already experienced significant changes because of sea level rise. Coastal forest habitats are being converted to salt-tolerant marshes and “ghost” forests, and releasing sequestered carbon into the atmosphere. Along the rest of the coast, sea level rise poses similar threats of habitat conversion, as well as erosion and flooding.
Supporter Spotlight
With quantifiable data, more parts of the world can better plan for rising seas.

“As long as there’s not really good data on the table, you cannot have a proper discussion about that,” Hooijer said. “But nowadays, data is there and the accuracy is so much higher.”
Hooijer used data from the ICESat-2, a NASA satellite using LiDAR that was launched in 2018. The ICESat-2 measures global land elevation, comparing it to the sea level. It offers essentially unprecedented accuracy, as well as a global data set — both things that allow researchers like Hooijer to ask targeted questions about worldwide sea level rise vulnerability. According to Hooijer, this study will be the jumping-off point for many more research questions.
LiDAR generates information about the physical characteristics of the Earth’s surface. It works by issuing laser pulses and timing how long they take to return to the origin point. The time the return takes creates a precise measure of elevation. NASA’s ICESat-2 issues 10,000 laser pulses every second, allowing for data with unprecedented detail. This data makes it easier to understand the current conditions as well as trends over time.
LiDAR technology has been around in some fashion since the 1960s. But in recent years, it has evolved significantly and is now much more accurate than before. Hooijer was able to use measurements of land elevation around the world with a much lower margin of error.
Previous Global Digital Elevation Models, or GDEMs, have relied on satellite radar, which has lower levels of accuracy. Radar at 0.05-degree resolution can only promise results within 0.5 meters of accuracy for 19.9% of land measured. By contrast, LiDAR from the ICESat-2 at a 0.05-degree resolution can achieve within 0.05 meters of accuracy for 85.2% of land.
One of the notable differences is that radar often has a hard time discerning vegetation from the ground. LiDAR can penetrate vegetation, allowing for more accurate measurements of land elevation. As GDEMs are often used for flood risk assessments, this data offers a much higher level of confidence in the results.
“It’s mind-boggling, this technology,” Hooijer said.
Until now, LiDAR data like this has only been used at smaller scales, for selected communities around the world. Hooijer’s study is the first global representation of this kind of information.
“Now that there’s better data, it’s almost an obligation for scientists and the policymakers to make better assessments that will lead to better planning,” Hooijer said.
In North Carolina, researchers at various institutions and universities use the latest developments in LiDAR data to ask targeted questions about environmental conditions in the state. Dr. Lindsey Smart, a research associate at North Carolina State University, has used non-satellite LiDAR data for several studies.
In 2020, Smart published a study called “Aboveground carbon loss associated with the spread of ghost forests as sea levels rise.” The paper used LiDAR data from 2001 to 2014 to map changing coastal landscapes over time. Smart was able to use this data to closely document habitat conversions that lead to aboveground carbon loss, demonstrating one critical way that sea level rise poses a threat to current coastal ecosystems.
Even in little more than a decade, Smart saw the capabilities of LiDAR technology evolve rapidly.
More accurate reads come from a higher laser point density — in other words, more lasers per area. Between the data Smart used in 2001 versus 2014, the laser point density increased 18-fold.
“The amount of detail that you can capture from data like that is amazing,” Smart said. “You have a whole wealth of research questions that you can ask that can be answered by these rich data sets.”
In recent years, LiDAR data has become more accessible to researchers. Not only is the data available, but it is obtainable without imposing a financial burden. According to Smart, the evolving capabilities and accessibility of LiDAR data allow researchers to more readily answer questions about these changing landscapes. This in turn helps states like North Carolina better predict what is to come.
“Organizations or state agencies can be proactive in terms of helping the communities adapt, or manage for future risks,” Smart said. “Some of those questions about where to do that can be answered by looking at LiDAR data and the changes in LiDAR data over time. And as time goes on, we’re getting more and more of that data.”


