The College of William & Mary’s Virginia Institute of Marine Sciences recently released its latest annual U.S. Sea-Level Report Cards, drawing on a collection of data that includes water level analysis from the past 52 years.
“Sea level is rising, but it’s also rising a little bit faster each year.”
Molly Mitchell, Virginia Institute of Marine Science, College of William & Mary
Consistent with preceding years, this year’s collection of trends, projections and explanations shows that in most places, sea levels have been rising in year-to-year comparisons, but the rate is faster than in previous decades.
Supporter Spotlight
The institute uses 32 tide gauges placed in ports and harbors across the country, from Wilmington all the way to the banks of Alaska. These tide gauges are maintained by the National Oceanic and Atmospheric Administration, and they take measurements every six minutes.
But the institute doesn’t simply use the measurements, instead, the researchers use a monthly average. This helps them look past anomalies like storms or fluke weather patterns and see the larger trends.
“Sea level is rising, but it’s also rising a little bit faster each year,” said Molly Mitchell, a marine scientist, assistant professor at the institute and one of the researchers responsible for the report cards. Mitchell said the trend is not surprising, but it is a problem.
The institute’s report cards do three things: they depict sea level changes and trends, forecast future trends and offer explanations of the changes at particular localities.
In some places, the sea level appears to be going down, but that measurement is relative to what the land is doing at the same time.
Supporter Spotlight
“There are actually falling rates in places like Alaska,” said Derek Loftis, an assistant research scientist who also works on the report cards. Loftis said there, the decrease is due to shifting tectonic plates, which essentially cancel out a rise in sea level.
The institute releases its report cards annually because, Mitchell said, a yearly update allows the researchers to see changes quickly and not be surprised by the results. They can document not only how much sea level has changed, but also the rate at which it changes.
“The sea level’s been rising as long as we’ve been measuring it. We’ve had tide gauges going back to the mid-1800s in some places,” said Mitchell. “But now that rate of acceleration is becoming very noticeable.”
To a certain extent, Mitchell said, the researchers can forecast trends. But whereas many climate predictions look ahead to 2100, Mitchell said the institute’s researchers limit their outlook to the next 30 years. Predictions must include the assumption that the future will be based on the past, said Mitchell, but because rates of acceleration have changed before, they can change again.
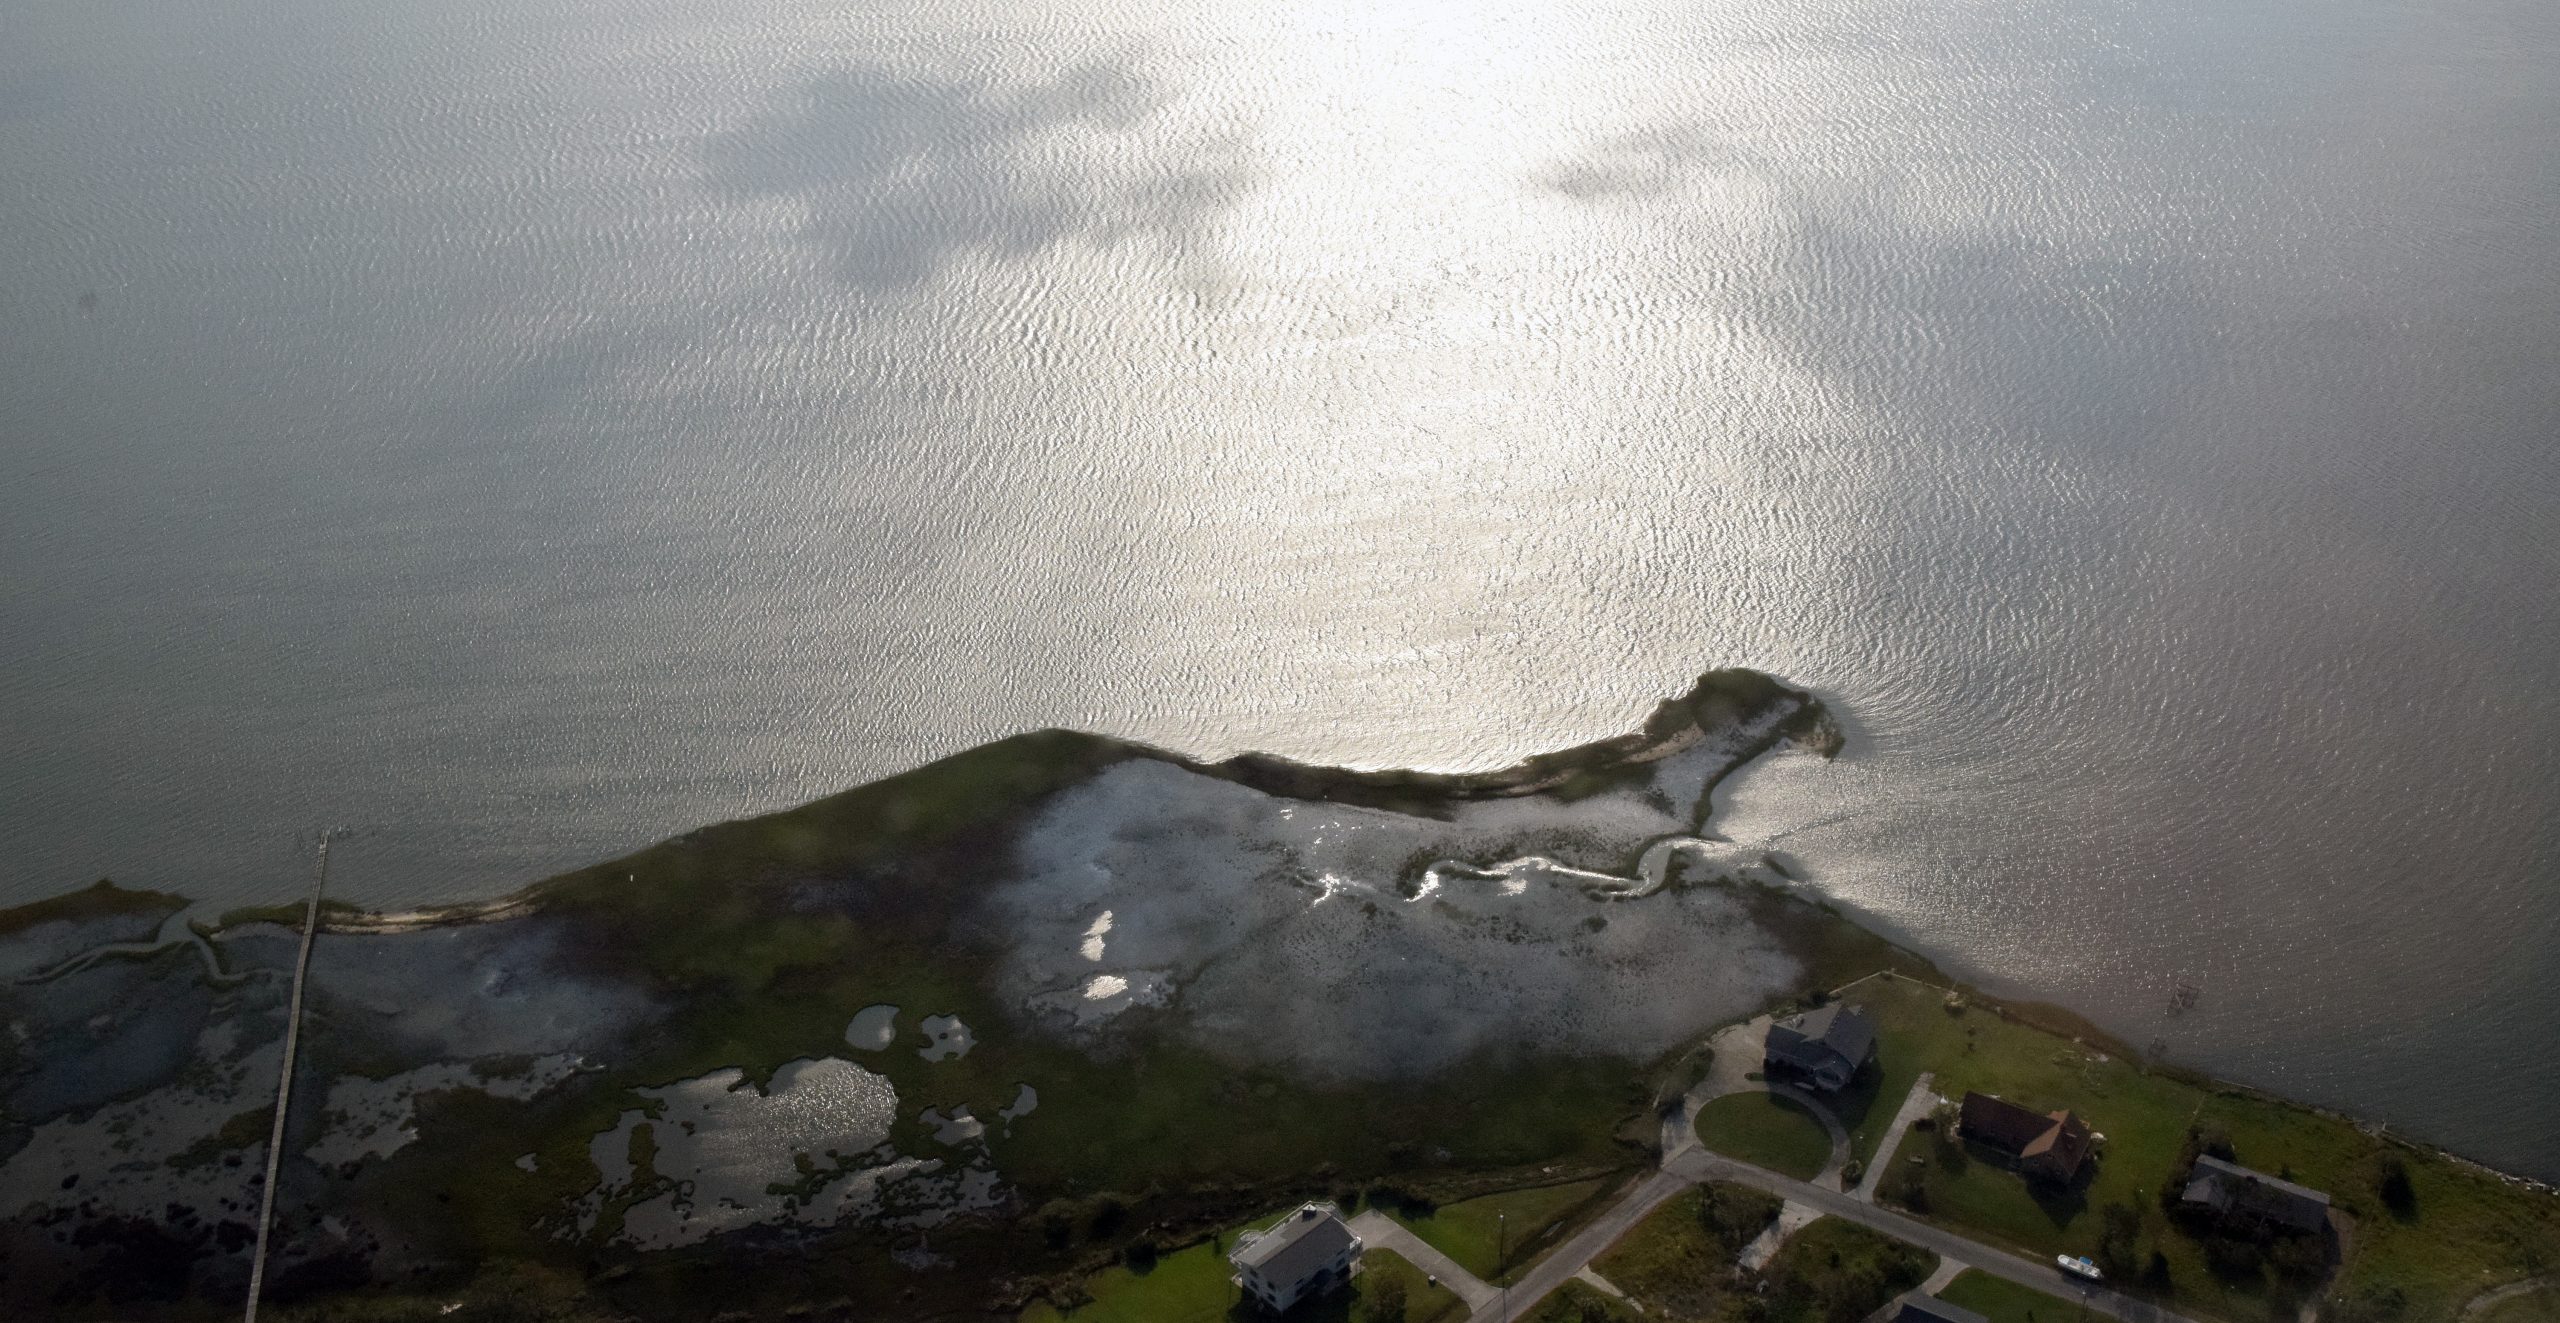
One of the tide gauges in Wilmington shows that the sea level in the area rose about 3 millimeters last year. Not an appreciable amount to the average coastal resident, but, Mitchell said, it’s enough to contribute to problems including frequent flooding, changes in coastal marshland and the need to build things like docks higher than during previous years.
Mitchell describes this continual sea level rise as a “slow emergency.” It isn’t a storm that is going to hit tomorrow, but over time it will cause bigger and bigger problems. But, said Mitchell, the report cards are a tool for planning at the local level.
Skip Stiles, executive director of Wetlands Watch in Virginia, agreed that adaptation is key for the future. Stiles and his team at Wetlands Watch work toward wetlands preservation and use data from the institute to further their mission. One of the group’s main objectives is adaptation, because the rising sea level is projected to affect a large percentage of Virginia’s coastal wetlands.
Stiles said the institute’s report cards make science accessible to everyone. And because that information is accessible, it can be used to adapt.
“Once you have that information, that locality can begin to plan,” said Stiles.
Wetlands Watch’s efforts to preserve coastal wetlands involve policy advocacy as well as street-level solutions, including the development of an app, called Sea Rising Solutions. This app takes a citizen-scientist approach to mapping out where flooding events occur.
Stiles said the project is as much about getting data to flood modelers as it is about engaging the whole community in the sea level rise conversation. Widespread community knowledge can enable developers and legislators to make adaptive decisions regarding sea level rise.
Stiles said adaptation planned for years in advance can help coastal residents deal with the “slow emergency” headed their way.

