BALD HEAD ISLAND – More than three decades’ worth of information is, for the first time, being pieced together to tell a story of sea turtle nesting habits on Bald Head Island’s shores.
Since the early 1980s, volunteers, interns and marine biologists each nesting season have been collecting data – identifying turtles, taking their body measurements, collecting blood samples, recording how often they lay their nests, the number of eggs they lay, where they dig their nests – for the Bald Head Island Conservancy.
Supporter Spotlight
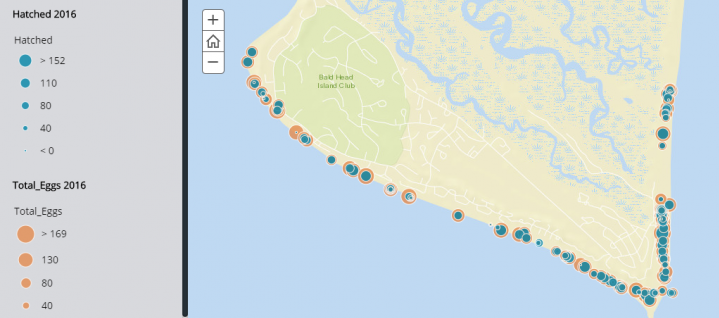
Now, thanks to a new graduate program at the University of North Carolina Wilmington, that information is being tidied up, cross-checked for accuracy and plugged into a map that paints a picture of sea turtle nesting trends on the island.
“Honestly, we need to look at what stories are hidden in there and we weren’t sure how to do that,” said Chris Shank, Bald Head Island Conservancy executive director. “The organization of the data wasn’t available to make it palatable for the public and our turtle nesting program is definitely in the public eye.”
In hopes of plucking those stories from deep within the numbers in “all of its unclean glory,” Shank decided to reach out to university faculty for help about a year ago.
He was eventually introduced to Mark Lammers, a professor and director of the university’s new data science program.

Lammers had been looking for opportunities for the program’s first cohort of graduate students to work on real-life “data sets.” These sets are a collection of records taken consecutively over a period of time.
Supporter Spotlight
“Since the data is 30 years old, a lot of it had been entered into notebooks by hand then transferred onto Excel spreadsheets,” Lammers said.
Thirty-seven Excel spreadsheets to be exact. That was the starting point for graduate students Olivia Bryson and Adam Silva.

“The data was there, but it probably took them two months to clean the data,” Lammers said.
Global positioning system, or GPS, coordinates taken of nest locations on the island had, in some cases, been incorrectly logged. Some of the coordinates plotted sea turtle nests in India rather than on Bald Head Island’s shores.
“It’s been very tedious,” Bryson said. “There’s lots of details.”
Since early in the fall semester of 2017, she and Silva have been cleaning up the data separately, then cross-validating their results.
“It’s kind of like a big game of cat and mouse,” Silva said. “There are some problems that are very obvious and it’s easy to fix them.”

Then, there have been instances when the timing simply doesn’t match up, leaving the pair to try and determine if the data is off by seconds or milliseconds.
“We are getting down to the nitty-gritty,” Bryson said.
They anticipate completing their work in the coming weeks, ultimately unfolding a big picture of the history of sea turtle nesting on the island.
It’s one that will tell the stories of individual turtles, which ones routinely return to lay their eggs on the island, follow their paths and see where they prefer to nest.

Take, for example, “Caretta,” a loggerhead aptly nicknamed “Sharkbite” because of a shark bite mark in her shell. Bryson refers to her as “our queen of the turtles.”
Based on the data sets, Bryson and Silva have learned that “Sharkbite” has had the most hatching sets, laid the most eggs and prefers to nest on Bald Head’s south-facing beach.
By looking at the historic trends of nesting turtles like her, the conservancy can begin to get answers to questions related to nesting habits.
“We would want to understand, do re-nourishing projects influence sea turtle nesting behaviors?” Shank said. “In terms of artificial light, what is the relationship between beach illumination and nesting? If you look at the maps there are some clear patterns of (nesting) clusters. Why are sea turtles cluster-nesting in those areas? It’s science. I don’t want to make it conclusive yet. What they have done is given us a tool for asking those questions.”
Shank said his goal is to publish the information once it is completed onto the conservancy’s website to give the public an opportunity to draw their own conclusions about the patterns recorded of nesting turtles over the decades.
“It takes time,” he said. “It’s not so easy to look at one, two, three, four or five years, but having 30 years of data, it’s easier to make long-term assessments. Look at the data, see what you think about clustering and think for yourselves.”


